FRET - Image analysis - Spillover factors (Page 6)
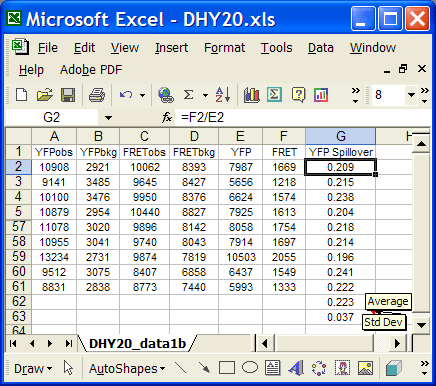
The data text file is manipulated to remove extraneous data and restructure the format to yield the following Microsoft Excel spreadsheet. We have created a Perl script to automate the process for our DeltaVision files. The Perl script will be available soon. However the manipulations can also be done through basic cutting and pasting in a word processor program and Excel. Columns A - D are the sum of the intensity values in the 5 x 5 pixel box. The YFP and FRET columns are the background subtracted total intensity values. YFP Spillover factor is calculated by dividing the FRET values by the YFP values. The average and standard deviation are then computed.
