FRET - Image analysis - Spillover factors (Page 5)
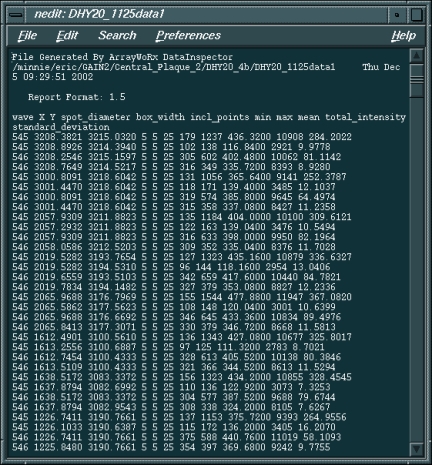
The process of collecting a YFP image, a YFP background image, a FRET image and a FRET background image is repeated approximately 60 times. With as little as 40 separate data points a reasonable average value can be calculated, but in general 60 narrows the standard deviation. In the end a text file is generated that will have all the data for the objects (in this case 60 different SPBs) in groups of 4, as shown, in part, below.

Note that the total intensity is the second to last value in each line.